Real Estate Investing
Price to Rent Ratio: What It Means for Buy vs Rent
The price to rent ratio is the median home price divided by median annual rent. A ratio under 15 usually means buying beats renting where you’re looking, while a ratio over 20 usually means renting is the cheaper move for now. Anything in between depends on your down payment, your mortgage rate, and how long you plan to stay put.
- Ratio under 15: buying tends to make financial sense
- Ratio 15 to 20: the math is close, run your specific numbers
- Ratio over 20: renting is usually cheaper on a monthly basis
Before you act on either side of that line, plug your actual price and rent into a rental yield calculator to see where your market really lands.
Key Takeaways
The price to rent ratio, calculated as home price divided by annual rent, gives a fast buy-versus-rent signal that must be adjusted for current mortgage rates and full ownership costs before you act on it.
| Point | Details |
|---|---|
| Formula | Price-to-Rent = Home Price ÷ (Monthly Rent × 12); use medians for markets, actuals for single properties. |
| Classic bands | Under 15 favors buying, 15 to 20 is mixed, over 20 usually favors renting. |
| Rate adjustment matters | Higher mortgage rates push the effective break-even point higher than the classic bands suggest. |
| The ratio omits real costs | Taxes, insurance, maintenance, vacancy, and closing costs all sit outside the basic formula. |
| Verify with free tools | Cashflowcalcs offers no-signup, in-browser calculators like the Rental Yield Calculator to convert a ratio into a full ownership-cost comparison. |
Table of Contents
- How Do You Calculate the Price to Rent Ratio?
- How to Calculate It for Your Own Market or Listing
- What Do Different Price to Rent Ratios Actually Mean?
- A Complete Worked Example You Can Check by Hand
- What Does the Ratio Leave Out?
- Which Markets Show High vs Low Ratios?
- How Should You Actually Use This Ratio?
- Try the Numbers Yourself With Free Calculators
- Sources
- FAQ
How Do You Calculate the Price to Rent Ratio?
The formula is straightforward: Price-to-Rent = Home Price ÷ (Monthly Rent × 12). You take the purchase price (or median home price for a market), multiply the comparable monthly rent by 12 to get annual rent, then divide. Investopedia’s definition frames it the same way: median home price divided by median annual rent.
A home renting for $2,000 a month gives an annual rent that, when divided into a purchase price around the mid-$300,000s, results in a price-to-rent ratio near 15.
The ratio has a mirror image worth knowing: rent-to-price percentage, calculated as monthly rent ÷ price. Flip that same example and you get 2,000 ÷ 360,000 = 0.56% monthly, or 6.7% annualized gross yield. Investors often find gross yield more intuitive than a multiple, since it reads like a return rather than an abstract number.
Quick reference: A price-to-rent ratio of 15 corresponds to roughly a 6.7% gross rental yield. A ratio of 20 corresponds to roughly 5.0%.
- Use median figures when comparing whole markets or metro areas
- Use actual listing price and actual asking rent when evaluating one specific property
- Never mix a metro median price with a single unit’s rent, or vice versa
How to Calculate It for Your Own Market or Listing
Getting a reliable number starts with matching your inputs correctly, not just plugging in whatever price and rent you find first.
- Find the median home price. Local MLS data, Zillow, or Redfin work for market level; use the actual listing price for a single property.
- Find comparable median rent. HUD’s Fair Market Rent data, apartment listing sites, or a local property manager’s rent roll all work, as long as the unit type matches.
- Convert monthly rent to annual rent. Multiply monthly rent by 12.
- Divide price by annual rent. That result is your price-to-rent ratio.
- Repeat for at least two or three comparable units to avoid basing a decision on one outlier rent.
Pro Tip: Match bedroom count and lease type before you calculate anything. A 3-bedroom single-family home compared against a 1-bedroom apartment’s rent will produce a meaningless ratio, even if both numbers are individually accurate.
What Do Different Price to Rent Ratios Actually Mean?
The classic bands are a useful starting filter, not a verdict. SoFi’s city-level analysis cites the commonly used thresholds:
- Below 15: buying is typically more affordable than renting comparable space
- 15 to 20: the decision is mixed and depends on your specific loan terms and time horizon
- Above 20: renting is usually cheaper, and buying carries more downside risk
Here’s the modern wrinkle. Those bands were popularized when 30-year mortgage rates sat well below 6%. With higher financing costs and rising property taxes and insurance premiums in many states, the break-even point shifts higher, meaning a ratio of 17 or 18 today can behave more like a rent-leaning signal than a mixed one, since a bigger share of your mortgage payment goes to interest rather than equity. Rate-aware analysis of the ratio makes the same point: the ratio itself hasn’t changed, but what counts as “affordable to buy” at a given ratio has moved.
Converting to yield helps here too. A ratio of 15 equals about 6.7% gross yield. A ratio of 22, like the Manhattan example below, equals about 4.5%. When your mortgage rate alone exceeds that gross yield, renting starts winning even in the “mixed” band.

A Complete Worked Example You Can Check by Hand
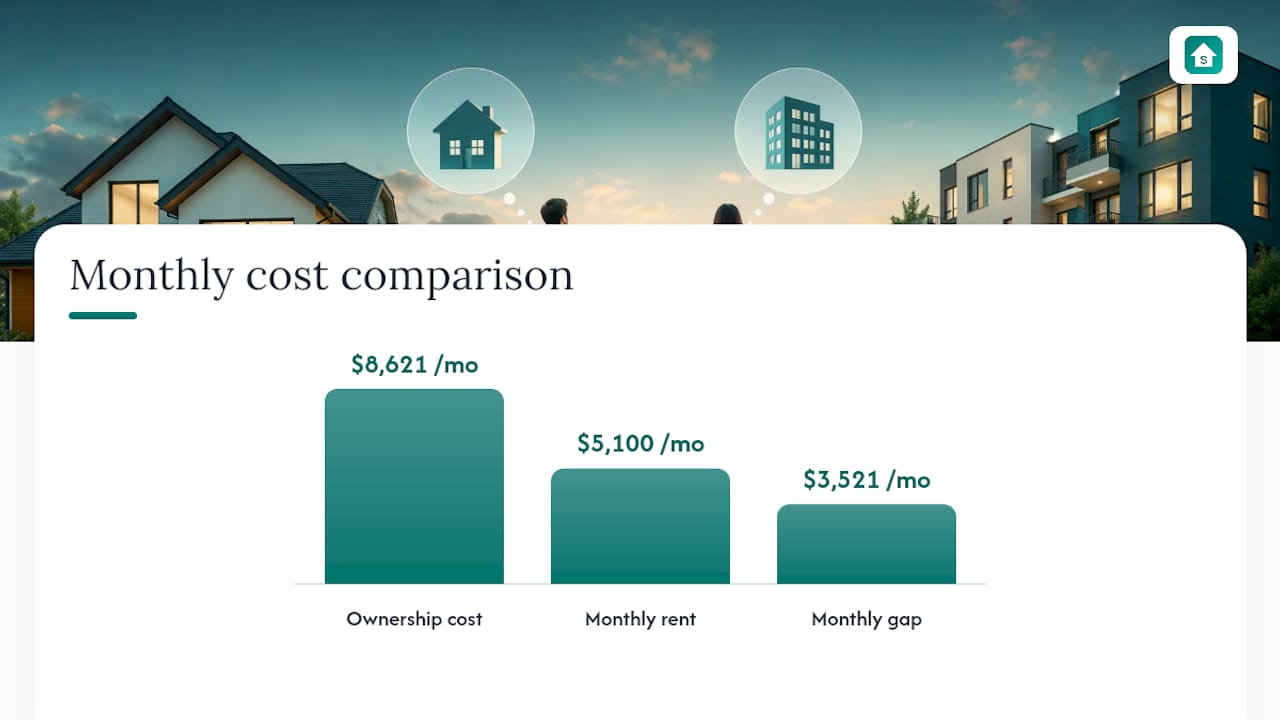
Here’s a full example with every input shown, so you can verify each step yourself instead of trusting a black box.
Wall Street Prep’s worked example uses Manhattan: a $1,344,000 median home price against $61,200 in median annual rent ($5,100 a month). Divide the two and you get 1,344,000 ÷ 61,200 = 22.0, a ratio squarely in rent-leaning territory.
Now layer in true ownership costs, which the raw ratio ignores entirely:
That $8,621 in true monthly cost against $5,100 in rent shows a gap of $3,521 a month, well beyond what the price-to-rent ratio alone suggests.
To reproduce and extend this yourself:
- Use the Rental Property Calculator to add mortgage, taxes, insurance, and HOA for true monthly cost
What Does the Ratio Leave Out?
The price-to-rent ratio is a screening tool, not an underwriting model. It says nothing about the actual cost of owning or the actual cost of managing a tenant.
- Property taxes, which vary enormously by state and county
- Insurance premiums, especially in flood or wildfire zones where rates have climbed sharply
- Maintenance and capital expenditures, typically 1% to 2% of property value annually
- Vacancy periods between tenants
- Property management fees if you’re not self-managing
- Closing costs, usually 2% to 5% of purchase price on the buy side
Run a couple of sensitivity checks before committing to either side of the decision. Test your mortgage payment at your quoted rate plus and minus one percentage point.
Pro Tip: Amortize your closing costs over your expected holding period to see the real monthly premium. $30,000 in closing costs spread over 5 years (60 months) adds $500 a month to your true cost of ownership, a number the raw price-to-rent ratio never touches.

Which Markets Show High vs Low Ratios?
Coastal, high-demand metros like New York, San Francisco, and Los Angeles routinely post price-to-rent ratios above 20, sometimes well above it, because home prices there have outpaced rent growth for years. Many Midwest and Sun Belt metros, by contrast, show ratios closer to 10 to 14, where rents have kept better pace with purchase prices.
- High-ratio metros: often coastal, supply-constrained, and price-appreciation-driven
- Low-ratio metros: often Midwest or Sun Belt, with more elastic housing supply
- A metro-wide average can hide sharp differences between individual neighborhoods
City-level lists are useful for a first pass, but treat them as a starting point rather than a final answer. A metro’s overall ratio can sit at 18 while a specific up-and-coming submarket within it sits closer to 13, or the reverse.
How Should You Actually Use This Ratio?
Treat the price-to-rent ratio as the first filter in a longer process, not the final answer.
- Investors: start with price-to-rent and rent-to-price as a quick screen. The 1% rule (monthly rent at 1% of price, or 12% annualized) is a fast triage heuristic, though many investors now treat 0.8% monthly as the realistic bar given higher financing costs. Deals that pass the initial screen should then go through cap rate, cash flow, and cash-on-cash return analysis before you commit capital, since the ratio alone omits financing and operating costs.
- Owner-occupant buyers: calculate your full monthly ownership cost, including realistic property tax and insurance estimates for the actual county, and compare that total against comparable local rents rather than against the list price alone.
- Both: ask your lender for a rate lock estimate and ask your agent or property manager for actual rent comps, not asking rents. Walk away if the gap between true ownership cost and rent exceeds what you can absorb for at least three to five years.
Try the Numbers Yourself With Free Calculators
Reading about thresholds only gets you so far. The real test is running your actual price and rent through the math, and that’s where Cashflowcalcs earns its keep: every calculator is free, requires no sign-up, and runs entirely in your browser, so your numbers never leave your device.
Start with the Rental Property Comparison Calculator if you’re weighing two specific properties or a buy-versus-rent scenario side by side. Enter purchase price, monthly rent, mortgage terms, taxes, and insurance, and it reconciles the same way the Manhattan example above did. If you just want the ratio and gross yield first, the Rental Yield Calculator gets you there in seconds, and the 1% Rule Calculator handles quick triage on a longer list of listings. Every result shows its formula, so you can verify the math instead of taking it on faith. These are educational estimates, not financial or tax advice, so confirm property-specific tax and insurance figures with local sources before you make an offer.
Sources
- Investopedia: price-to-rent ratio
- SoFi: Price-to-Rent Ratio in 52 Cities
- Wall Street Prep: price-to-rent ratio (example)
This article is general information, not a substitute for advice from a qualified financial advisor. Consult a qualified financial professional about your own circumstances before acting on anything here.
FAQ
What Is a Good Price to Rent Ratio?
A ratio under 15 is generally considered favorable to buying, while a ratio between 15 and 20 is mixed and depends on your mortgage rate and how long you plan to stay.
What Is the 2% Rule for Rentals?
What Is the 5% Rule for Rent vs Buy?
Where Can I Check This for My Own Property?
Cashflowcalcs’ Rental Yield Calculator and Rental Property Comparison Calculator let you enter your own price and rent figures and see the ratio, gross yield, and full ownership cost side by side, with no sign-up required.