Taxes
Investors: Gross Potential Rent, Numbers First With a 12 Unit Example

Gross Potential Rent (GPR) is the maximum rental income a property could generate if every unit sat occupied at full market rent with zero vacancy, concessions, or unpaid rent. It’s a theoretical ceiling, not a forecast of what you’ll actually collect. Investors and lenders use it as the starting line for building Effective Gross Income (EGI) and, eventually, Net Operating Income (NOI).
TL;DR:
- Market rent assumptions must be supported by recent lease comps, HUD Fair Market Rent data, and active listings to avoid overstating GPR.
- A typical GPR includes potential rent income plus ancillary fees like parking and laundry, averaging 3% to 8% of total revenue depending on the asset.
- Adjusting GPR for vacancy, loss to lease, concessions, and collection losses is essential for calculating realistic Effective Gross Income.
- Overestimating market rent or including uncollected ancillary income can significantly inflate GPR figures used by lenders and investors.
- Using free tools to verify GPR and NOI calculations helps assess deal viability without relying on opaque spreadsheet models.
Table of Contents
- What Does Gross Potential Rent Actually Include?
- How Do You Calculate Gross Potential Rent?
- A Worked Example: 12-Unit Property With Ancillary Income
- From GPR to EGI: Why the Ceiling Isn’t the Forecast
- Common Mistakes That Inflate Gross Potential Rent
- Where to Find Defensible Market Rent Data
- How Lenders and Investors Use GPR in Underwriting
- Run Your Own GPR and NOI Numbers Free
- Sources
- FAQ
What Does Gross Potential Rent Actually Include?
GPR has two components: potential rental income and potential other income. The first covers every unit’s rent if leased at current market rates. The second covers ancillary revenue like parking, laundry, storage, and pet fees, which industry data pegs at roughly 3% to 8% of total revenue depending on the asset type and market.
The critical distinction underwriters watch for is market rent versus in-place (contract) rent. Market rent is what a unit would command if listed today. In-place rent is what the current tenant actually pays, often locked in from a lease signed a year or two ago. The gap between the two is called loss to lease, and it matters because:
- Using stale in-place rents instead of current market rents understates a property’s true income potential.
- Overstating market rent without comps to back it up inflates GPR and everything built on top of it.
- Loss to lease shrinks naturally as leases turn over, so it’s a timing issue, not a permanent loss.
Getting this input right determines whether every downstream metric, from GRM to cap rate, holds up under scrutiny.
How Do You Calculate Gross Potential Rent?
The core formula is straightforward: GPR = Σ (unit count × market rent per unit × 12) + potential other income. For a single-unit rental, that’s just monthly market rent times 12. For multifamily properties with several floor plans, you calculate each unit type separately and then sum them, a method CommLoan’s underwriting guidance recommends for accuracy.
Here’s the step-by-step process:
- Identify every unit and its current market rent (not the rent the tenant happens to be paying).
- Group units by floor plan or type if the property has more than one.
- Multiply each unit’s monthly market rent by 12 to annualize it.
- Sum the annualized rent across all unit types.
- Add potential other income (parking, laundry, storage, pet fees) at its annualized value.
- Present the total as an annual figure, then divide by 12 if you need a monthly view for cash flow modeling.
For square-foot leases common in commercial or student housing, substitute rent per square foot times leasable square footage for the per-unit rent figure. Round to the nearest dollar. Rounding to the nearest hundred hides real variance across unit types.
A Worked Example: 12-Unit Property With Ancillary Income
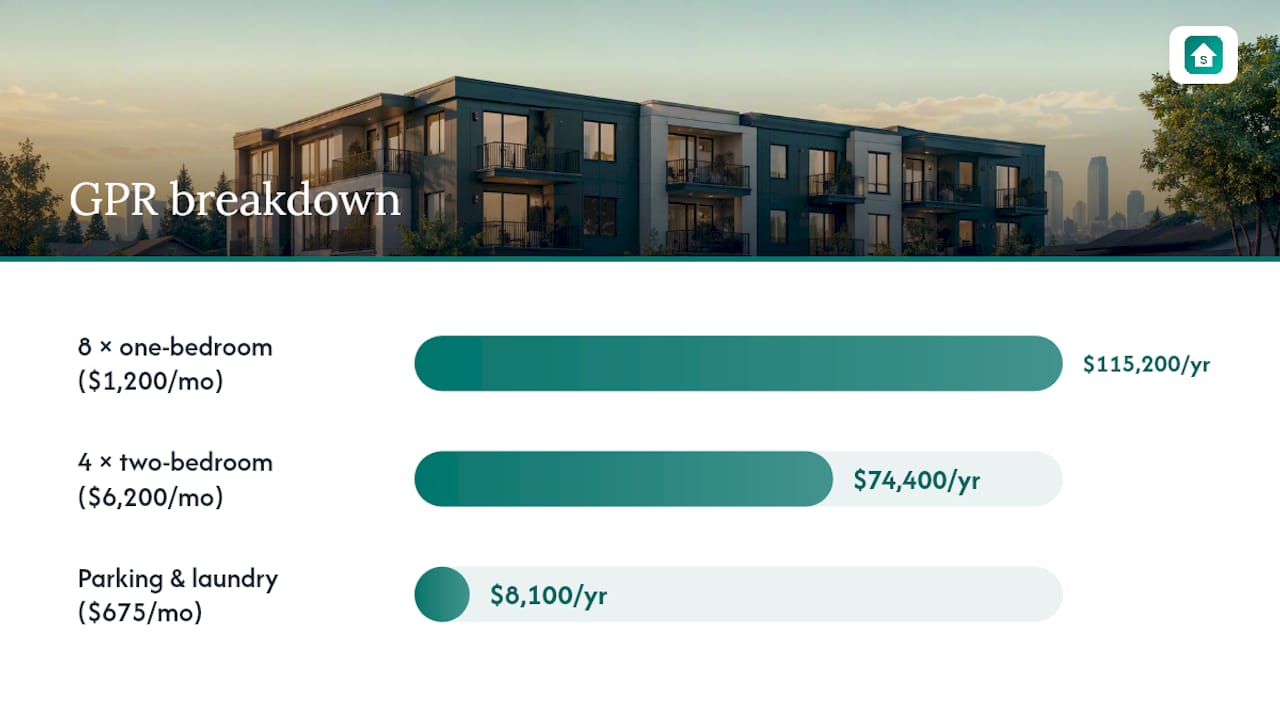
Consider a 12-unit apartment building with two floor plans and a small parking income stream. Here’s how the math reconciles from unit count to annual GPR.
Walk through the arithmetic: 8 one-bedrooms at $1,200 produce $9,600 a month, or $115,200 a year. The four two-bedrooms add $6,200 monthly, $74,400 annually. Parking and laundry contribute $675 combined per month, $8,100 a year. Add all four annual subtotals and you get $197,700 in gross potential rent, the ceiling this property could theoretically produce.
From GPR to EGI: Why the Ceiling Isn’t the Forecast
GPR assumes perfection: full occupancy, on time payment, no discounts. Real properties never hit that. Converting GPR into a realistic revenue number, Effective Gross Income, requires subtracting the gap between theory and reality:
- Vacancy loss: income lost to unoccupied units, typically expressed as a percentage of GPR.
- Loss to lease: the difference between market rent and what in-place tenants actually pay.
- Concessions: free rent, reduced deposits, or move-in specials offered to attract tenants.
- Collection loss: rent billed but never collected due to delinquency or eviction.
The formula: EGI = GPR − vacancy loss − loss to lease − concessions − collection loss + other income.
Statistic in context: Apply a conservative vacancy and collection loss assumption to the $197,700 GPR example above and you land near $187,815 in EGI, before subtracting operating expenses to reach NOI. That gap is the real world showing up in your spreadsheet.
Common Mistakes That Inflate Gross Potential Rent
The single most common error is anchoring market rent to whatever the current tenant pays instead of pulling actual comps. A seller who hands you a rent roll and calls it GPR, without ever mentioning EGI, vacancy history, or comps, is showing you the best-case number and hoping you stop there.
Other red flags worth checking before you trust a GPR figure:
- Ancillary income lines (pet fees, storage, laundry) that aren’t currently being charged but appear in projections anyway.
- Market rent assumptions that exceed every comparable listing within a half-mile radius.
- No mention of trailing 12-month EGI or actual collection history alongside the GPR figure.
- Renovation-driven “stabilized” rents presented as current achievable rents.
Pro Tip: *Cross check any seller-supplied GPR against recent lease comps, HUD Fair Market Rent data for the county, and three to five active listings for comparable units.
Where to Find Defensible Market Rent Data
Your GPR is only as credible as the comps behind it. Reliable sources include your local MLS for recent lease signings, HUD’s Fair Market Rent datasets for a conservative county-level benchmark, active rental listings on major platforms, and municipal rent registries where they exist.
When you pull comps, adjust for:
- Unit condition and finish level (renovated units command a premium over dated ones).
- Concessions baked into the advertised rent (a listing showing “$1,400, one month free” isn’t really $1,400).
- Seasonality, since rents in college towns or seasonal markets can swing 10% or more between peak and off-peak months.
- Building amenities like in-unit laundry, parking, or a fitness center that comps without those features won’t match.
Keep a simple worksheet logging each comp’s address, date, rent, and adjustments. That paper trail is exactly what lenders ask for when they verify your rent roll.
How Lenders and Investors Use GPR in Underwriting
GPR feeds a chain that ends at implied property value: GPR flows into EGI, EGI minus operating expenses produces NOI, and NOI divided by the market cap rate produces implied value. Overstate GPR by even 5%, and that error compounds through every step, inflating what a property looks like it’s worth on paper.
Lenders don’t take GPR at face value. Underwriters typically:
- Verify market rent assumptions against independent comps rather than trusting the borrower’s projections.
- Apply their own vacancy and collection loss assumptions if the submitted numbers look aggressive.
- Check that projected Debt Service Coverage Ratio clears roughly 1.2, a common minimum threshold for multifamily and commercial loans.
- Request a trailing 12-month rent roll, historical EGI, and third-party rent comps before closing.
For value-add deals, sharp investors calculate GPR twice: once at current achievable market rent, and again at stabilized rent after planned renovations, so lenders can see the path from today’s number to the projected one.
Run Your Own GPR and NOI Numbers Free
Reading the formulas is one thing. Testing your own property’s numbers against them is what actually tells you whether a deal works. Cashflowcalcs gives you that without asking for an email address or a credit card, a real advantage over spreadsheet templates that hide their math or require a signup wall before you see a result.
The Rental Property Calculator walks you from GPR through EGI, NOI, cash flow, and cap rate in one pass, and every step shows the formula behind it so you can verify the output instead of trusting a black box. If you’re comparing two or three properties at once, the Gross Rent Multiplier Calculator gives you a fast price-to-GPR read to see which deal is priced more reasonably relative to its income potential. Both run entirely in your browser, and both are free.
Keep in mind these tools produce educational estimates, not tax or legal advice. For anything touching your actual return, depreciation schedule, or loan qualification, confirm the numbers with a CPA or your lender. Start with the Rental Property Calculator and plug in your next deal’s unit mix to see where it lands.

Sources
Save these for every deal you evaluate: HUD’s Fair Market Rent datasets for county-level rent benchmarks, Fannie Mae’s Multifamily Guide for lender-standard income analysis, and your local MLS for actual lease comps. Screenshot or export each source when you pull a number, since lenders will ask to see where it came from.
- What Is Gross Potential Rent (GPR) and How to Calculate It? (CommLoan)
- HUD user, Fair Market Rents (FMR)
- What is gross potential rent and how is it calculated? (LegalClarity)
FAQ
How do you calculate GPR?
Multiply each unit’s monthly market rent by 12, sum that across all unit types, and add any potential other income like parking or laundry. The formula is GPR = Σ (unit count × market rent × 12) + other income.
Is 40x rent gross or net?
The 40x rent rule (a household needing annual income at least 40 times the monthly rent to qualify) uses gross income, meaning income before taxes and deductions, not net take-home pay.
How much should I pay in rent if I make $75,000 a year?
Using the common guideline of spending no more than 30% of gross income on rent, that’s roughly $1,875 a month; the 40x rule would qualify that same income for rent up to about $1,875 as well, since $75,000 divided by 40 lands near the same figure.
What is the 2% rule in rentals?
The 2% rule suggests monthly rent should equal at least 2% of the purchase price for a deal to likely cash flow well, though it’s a rough screening tool, not a substitute for calculating actual GPR, EGI, and NOI.